Focus and simplicity… once you get there, you can move mountains!! – Steve Jobs
Recently while talking to one of the category managers of a Japanese confectioneries manufacturing company, we were discussing how across multiple trade channels like general trade, modern trade, D2C, confectionery businesses are conducting their business.
Amidst the discussion for all three different trade channels the manager was telling me different metrics which are of prime importance. For eg for General trade it was brand value, for modern trade it was AOV (Average order value) and for D2C it was COGS (Cost of goods sold) and Logistics cost.
While listening to him, the analyst part of me started backward thinking on how the focus on these metrics would define their day to day decision making processes, strategy and initiatives behind the product.
This single important metric is nothing but the “North Star” Metric.
Coined by Sean Ellis, an American angel investor & entrepreneur.
But why the word – North Star ?
This star was used as a navigation tool for thousands of years by travelers in the northern hemisphere to reach their final destination.
In business, this metric best captures the core value of a product to customers. Focusing on this metric is key to driving sustainable growth across the customer journey and lifetime value.
Simply put, the North Star metric is an objective led – end goal – focused exercise of breaking down the overall company strategy into terms that everyone can –
- remember,
- understand, and
- apply in their respective domain of work.
The idea behind analyzing this metric is when it grows, then the company should grow too. If customers are getting benefited then growth of the company should also go positive.
The metrics have 2 core subsets.
- Input metrics
- Output metrics
These subsets in turn help to derive 3 questions regarding business.
- Why
- How
- What
For eg: Lets see North Star metric for spotify.

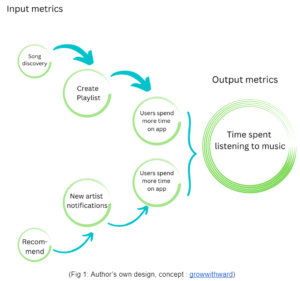
For Spotify to increase revenue they need users to spend more time on the app. This is an output metric which will help to track retention rate. But here is a catch, only measuring output metrics will not give the full answer on why the users are leaving or what is making them retain themselves to the app.
So it also needs to measure input metrics. So let’s go backwards, in order to let users spend more time on the app, they need to be notified for new artists or for similar songs based on the preferences and since the users come back to listen to more songs, create a playlist for their convenience.
By measuring input metrics it helps one to understand what drives the output and the entire company understands the why, how and what behind the product performance.
Above mentioned example shows that knowing the right KPI’s (Key performance indicators) can help you design the North Star framework. But what if you don’t know the KPI?
Not knowing the KPI means North Star is not decided and this means the final outcome is not decided. In this case North star will act as a laggard indicator and teams don’t know what will spur the growth for the company.
Let’s take an example of YouTube.
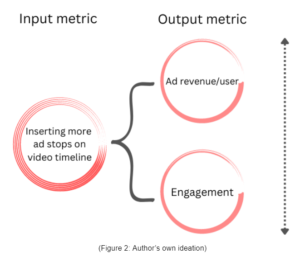
Assuming that YouTube would only see the final outcome of the product through input metric.

Solution seems to be simple for youtube in terms of increasing the revenue through ads. To simply put more stops of ads on the video timeline. But it isn’t this simple.
Adding more ad spots results in poor user experience due to constant nudge of ads. This in turn reduces the engagement and hence ad revenue/user also reduces. And we are back to square one again!!
Hence choosing the right north star metric becomes important!
So how to find the right output and input metric to find the perfect north star?
Following list (not exhaustive) should be a good starting point.
- Revenue
- User growth
- Volumetric growth
- Engagement growth
- Unit economics
- User experience
All of these points further have classification and execution differentiation, this is for the next blog.
But consider this that the North Star metric is not a vanity metric.
An app having ~10K DAU ( Daily active users), average ~10 Mins of usage time and having ~1 million app downloads. So why do these numbers matter? Does it have significance? For eg – did revenue increase by 30%? Are users organically increasing?
Having right north star metrics helps to derive the information out of the data sets generated by the business. Even if the focus is only on input or output metric it will give the right direction in terms of understanding the fundamental what, why & how behind the business.
Lastly, the North Star metric evolves with the “S” curve of the business.
(Figure 3: Author’s own ideation)
North star metric helps to propel the business from one inflection point to another and if not then it acts as a laggard indicator.
For the execution and further classification of the north star metric, watch this space for more!!
Author(s) :
Dr. Archit Shah

