India makes up 2.4% of the total area of the world (3.28 Mn km2), the 7th largest country in the world, with every type of landscape imaginable
- from snow-capped mountains (Kanchenjunga, Height = 8,586 m is the 3rd tallest mountain) to vast deserts (the Thar desert covers 61% of Rajasthan and is the 7th largest desert in the world) and
- from long coastlines (9,506 km across 8 states) to expansive deltas (Sundarban delta, Area = 10,277 sq km, the world’s largest delta).
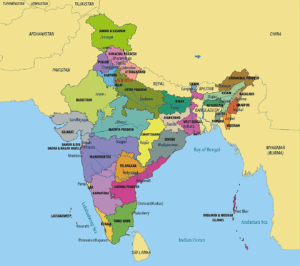
If you were to show the map of India to someone and ask – which country shares the longest border with India the answers would be either China (3,488 km long border) or Pakistan (3,323 km long border) given their obvious size on the map, but they are both 2nd and 3rd after Bangladesh (4,096 km long border) which has a 600km longer border than China, despite the significant size difference.
Distortion Effect: Mercator Projection
Part of the reason for these distortions in how we have always seen things on a map vs how they really are is because of something called map projections, that depicts the world as a flat, two-dimensional surface (from the actual 3D spherical geoid shape of the earth) which can distort the proportions (recall that area of a sphere is 4𝛑r2 whereas the area of a rectangle is lxb). Some of the projection types are depicted below.
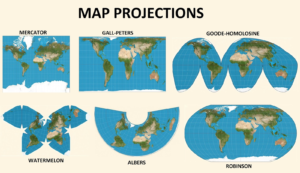
Types of Map Projections
The most commonly used projection amongst these is the one on the top left – also known as The Mercator (Latin for Merchant) Projection – a cylindrical map projection created in 1569 by sailors and naval officers for easier navigation, given that it is a conformal projection which preserves direction and angles (i.e. easier to measure distances between two bodies on a 2D surface), with local shapes (i.e. those closer to the center) preserved, but objects farther away from the center getting distorted. Refer to the illustration and the scaled map below.
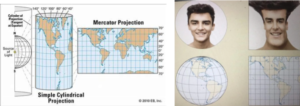
Mercator Projection: Formal and Informal Illustration
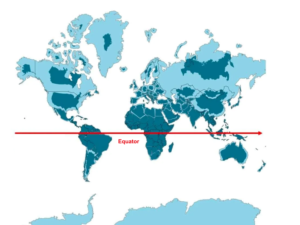
Mercator Projection: Actual (Dark Blue) vs Recorded (Light Blue) Areas of Different Countries
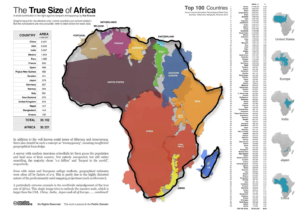
In a Mercator map, for e.g. Greenland appears larger than Africa, despite being 14 times smaller in reality. Here is the true size of Africa for reference, which is about as wide (7,400 km) as Russia (7.500km) despite the sheer size difference in regular maps.
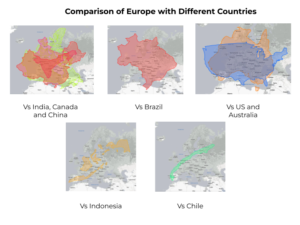
Here is Europe for reference compared to different regions of the world
VC || Startups – Parallels
In the VC and startup ecosystem, the Mercator projection can be used as a metaphor for the way that potential size of opportunities is assessed. Just as the Mercator projection distorts the size and shape of landmasses, investors and founders often focus on a few key metrics when evaluating/pitching a startup, which can lead to a distorted view of its true potential.
In his book Zero to One – Peter Thiel (Co-founder Pay-Pal, Palantir and Founders Fund) talks about how all happy (successful companies) are alike – they are monopolistic (i.e. close to no competition) in nature without appearing to be and avoid scrutiny by distorting their market size.
- Take the case of Google, which is primarily a search engine. Google currently accounts for a majority share of the total search market. (Its closest competitors, Bing and Yahoo!, have about 5% collectively, however, new age tools like Perplexity, ChatGPT, amongst others, are also being used increasingly). For e.g., say now that Google is an advertising company that also sells hardware (Google phones, watches, tablets and earbuds) along with software (Google workspace for enterprises), that changes the outlook, suddenly making Google (search engine) a smaller fish in the much bigger pond. (In this case , the valuation and outlook gets revisited) .
- In contrast take the case of a local North Indian restaurant in your vicinity, surely there are 100s of restaurants in a 5 km2 area, yet for a restaurant to say that their moat (differentiating factor) is simply an ‘old generational recipe for paneer makhni’, they are appearing to be a bigger fish but are actually in a smaller pond and not likely to stay competitive in the long run.
To put it simply
- Non-monopolists exaggerate their distinction by defining their market as the intersection of various smaller markets: North Indian food ∩ restaurant ∩ New Delhi
- Monopolists, by contrast, disguise their monopoly by framing their market as the union of several large markets: search engine ∪ mobile phones ∪ wearable computers ∪ self-driving cars
In the case of early stage startups for example a startup that is based in a small market (TAM) may appear to be less attractive than a startup that is based in a larger market with a larger pool of customers (SAM), even if the small market startup has a higher potential for acquiring majority share (SOM).
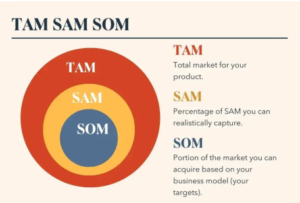
TAM = Total Addressable Market, SAM = Serviceable Available Market, SOM = Serviceable Obtainable Market
To avoid falling into the trap of the ‘Mercator distortion’ both founders and investors can take more proactive measures
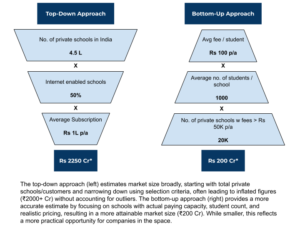
- Founders can use a bottom up approach to market sizing rather than a top-down approach to present a realistic idea about the opportunity at hand (TAM) and what percentage of it can they realistically capture (SOM). Take the following example of market sizing for a company that sells learning and school management software to private schools (*numbers are indicative)

- Similarly investors need to look beyond traditional metrics and consider a wider range of factors when evaluating startups. This includes factors such as
- the teams’ execution capabilities,
- the core product/service offered, and
- the defensibility of the business model
Takeaway
Just as the Mercator projection distorts our perception of geography, investors and founders must recognize and adjust for similar distortions in market perception.
A startup’s true potential isn’t always reflected in surface-level metrics like TAM and requires deeper analysis of execution, competitive moats, and long-term scalability.
For founders, this means
- presenting their business within the right frame,
- highlighting real competitive advantages without inflating market potential.
For investors, it means
- questioning apparent market sizes, and
- looking beyond conventional metrics.
By understanding these distortions, both investors and founders can make better decisions and unlock opportunities that might otherwise be overlooked.
Author
Aditya Golani